Fourth Entry
Happy New Year!
Remember my first blog entry about Land Use Plans and Provincial Physical Framework Plans? One thing that was missing during that time is that I was not able to take the granularity up to the City/Municipal level because I lack the necessary skillset in data cleaning before. Also, the data that I used before was as of 2015.
But thanks to the people from the Philippine Environmental Planning community that I was able to get a more recent data, which was as of 2nd Quarter of 2019. This dataset looks a lot better and cleaner compared to the previous one that I got. The older one has a really messy date column.
So then, presenting the CLUP Status Monitoring Dashboard! (Oops it looks a lot better in full screen! Click the full screen mode on the lower right of the dashboard)
Simple instructions on how to use it:
- Hover your mouse on the map to see the ff: city/municipality, province, PSGC Code, date of approval of latest CLUP, and status of CLUP.
- Check the legend on the upper right! For formulation means that the specific city or municipality does not have any CLUP at all.
- Use filters at the top. You can also search a specific city/municipality; search bar is on the map.
- The progress bar can also serve as filters. Just click on it. Will improve this later on. There’s one action that I want to include there.
How I Made the Dashboard (and other data janitorial stuff)
I got the data from HLURB, but as usual, the problem is that it’s in PDF format. So I had to convert it into an excel file. But…it imposed more problems. The raw data of the PDF file seems to have it on repeat header rows, so I had to manually erase those rows one-by-one.
After so, I did the rest of the cleaning using python. You can check the code here.
But to summarize the steps on further cleaning the excel file:
I had to convert some of the columns to
string, convert them to uppercase to make things easier, replace some weird names likeNAN, remove values with parenthesis (huhu thank you RegEx super helpful), remove weird extra spaces which I suspect came from PDF conversion.I had to separate Metro Manila from the excel file first. The reason for this is that the
shapefleof the City/Municipality Admin Level (Level 3) aggregated Metro Manila into districts. Which is also a problem because the Barangay Admin Level (Level 4) aggregated the Manila City dataset into different districts (e.g. Tondo, Sta. Ana, etc.). That’s basically what we do not need. We only need the 16 cities and 1 muncipality of Metro Manila, nothing more and nothing less in terms of aggregation.Going back to the dataset minus Metro Manila, I merged the excel file and the city/municipality shapefile, but this has been a long process as well. Because for every merging that I did, I had to check if there are
nullvalues (i.e. values that did not match). Since the excel file – or rather the PDF file – did not contain any PSGC codes, I had to do the merging based on their names. Oh and let us not forget that there might be cities/municipalities with the same name but different provinces. So I had to write a code also for that. Going back to the null values, I had to make sure that all of the values should match. And thankfully after some trial-and-error, I was able to merge all of the values.Oof but wait, we’re not done yet because we still had to clean the Metro Manila dataset. This one’s a bit easier already because we’re only dealing with 17 LGUs. But basically I used the barangay dataset of Metro Manila that I got years ago, and had to dissolve them into city/municipality level, replaced the districts of Metro Manila to
CITY OF MANILA. Once done, I merged the Metro Manila dataframe with its geodataframe counterpart.Now that the Metro Manila and the rest of the Philippines datasets are clean already, I concatenated these 2 using
pd.concat. (Pandas is such a powerful python library. I think I can’t live without it already.) Then I just saved the concatenated files into a shapefile!
Once I’m done with the dataset, I loaded them to Tableau. For the dashboard, I chose two (2) charts: 1.) Categorical Map and 2.) Stacked Bar Charts. I just made a few interactions for the two especially on the click-and-action stuff so that it would be easier for those who will use.
Some Fresh New EDAs
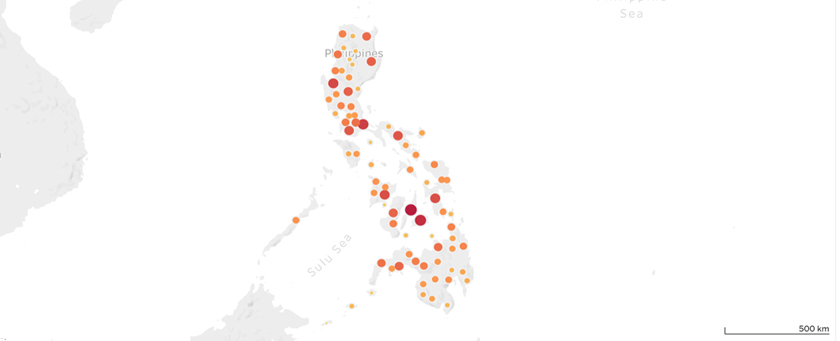
1. The provinces of Maguindanao and Lanao Del Sur have the most number of cities and municipalities who do not have CLUPs yet.
Oops. I guess the cities/municipalities of these two (2) provinces should catch up on what they want to be 10 or 20 years from now. It’s for their children and grandchildren’s sake.
2. We have a lot of outdated CLUPs, and this could be a future problem on how we use our land in the Philippines.
If you noticed the dashboard, we have a lot of areas still colored in yellow. Outdated CLUPs are a big problem as we would not know how to shape our land as a resource. Outdated CLUPs also mean that they are not anymore aligned with the national plans of our country - such as railroads to be constructed in the future.
Out of the 1,634 LGUs in our dataset, 1,037 LGUs have outdated CLUPs already. And those 159…we do not know if what are their plans in life (yet) lol.

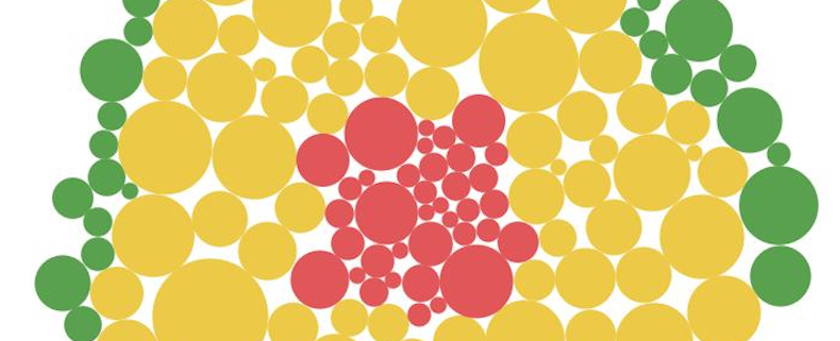
Too much yellowwwwwww
To summarize:
- Outdated: 63.46%
- Updated: 26.81%
- For Formulation: 9.73%
3. The band 1975 is shookt because they will be replaced by a band called “1978” – and it will have six (6) members
Lol kidding aside, there are 6 LGUs whose CLUPs are super outdated already (their last plan was 1978). Three (3) are from Region V, two (2) are from BARMM, and 1 from CAR.
Anyway, these are:
- Daet, Camarines Norte
- Labo, Camarines Norte
- Viga, Catanduanes
- Bontoc, Mountain Province (I miss the coffee and hot chocolate here. The best!!!)
- Marawi City, Lanao Del Sur
- Jolo, Sulu
Speaking of Marawi City, I’m assuming that their CLUP is currently on the works now because of the last year’s events, and I hope and pray that the people there are brimming with hope on making their city a better one. So they should really start with a CLUP!
Anyway, I hope This will be useful for HLURB and other planners to easily monitor which areas do not have CLUPs yet. If you are from the LGU and you need assistance in crafting CLUPs, please refer to the Philippine Institute of Environmental Planners and look for your local PIEP Chapter!
Always remember Daniel Burnham’s famous quote:
“Make no little plans; they have no magic to stir men’s blood and probably will themselves not be realized. Make big plans; aim high in hope and work, remembering that a noble, logical diagram once recorded will not die.”


